Do you understand Image Histrograms? - Understanding Histogram is very important while shooting or editing in Photoshop. : PART-2

Hope you have checked Part-1 of this series, where we discussed the basic reasoning of the thought around better understanding of Histograms in Digital SLR Cameras and Photoshop like applications. If not, click here and come back to this article.
Histogram
is one of the best tools in Digital Cameras; from simple point-n-shoot
cameras to Digital SLRs. Most of the recent cameras have the capability
of showing Histrogram on LCD screen they have on back side. Most of the
cameras also give an option to see photograph clicked an corresponding
Histogram. Many cameras also have capability of combined histograms for
RGB and individual histograms for Red, Green and Blue separately. At
times individual histograms are more useful. How? We will discuss that.
Histogram
is a simple graph that displays where all of the brightness levels
contained in the scene are found, which is from the darkest to the
brightest. These values are shown across the bottom of the graph from
left (darkest) to right (brightest). The vertical lines (height of
points ) shows how much of the image is found at any particular
brightness level. This count is actually number of pixels.
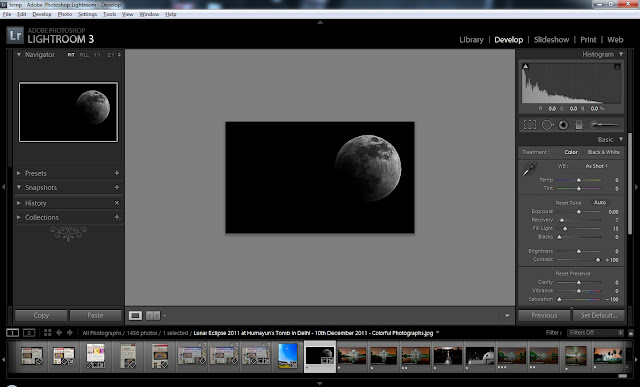
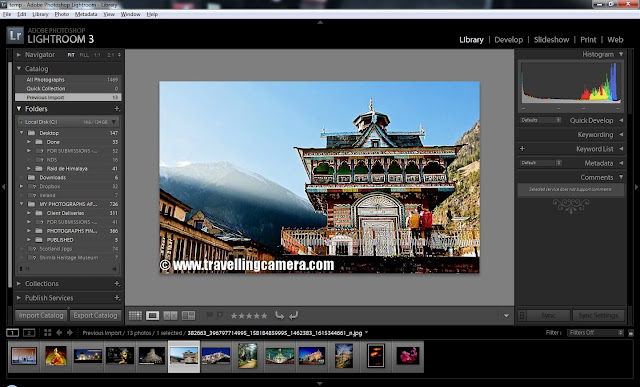
Before
we dive deep into the concept of Histogram, I would like to share some
examples with sample photographs and will leave you here for guessing
it's meaning and how a histogram is related to a photograph. Then we
shall move into the discussions about RGB Histogram and Individual
Colored Histograms. Let's check out these images...
I
know I haven't written anything about these photograph. Just look at
the photograph and corresponding Histogram and try to find out a
relation. No need to worry even if you fail to understand, because we
shall discuss these in detail in upcoming post on this blog.


.jpg)
Comments